Contents
Get a Personalized Demo
See how Torq harnesses AI in your SOC to detect, prioritize, and respond to threats faster.

Roman Kunicher is a Product Manager at Torq focused on HyperSOC case operations and SOC visibility. With 10+ years in cybersecurity and a hands-on technical background, Roman has spent his career partnering with R&D, Sales, customer teams, and partners to translate real SOC needs into practical outcomes. Before Product, he served as a Security Solution Architect and Product Specialist at Torq, bridging field reality and product execution.
Security teams spend too much time turning case data into decisions that other people can act on.
The data exists, but it’s rarely organized into a continuous, shared view of cross-case operations: one place that surfaces what’s driving pressure (e.g., open case backlog, SLA risk, critical spikes), how performance is trending over time, and where the SOC should focus next, so each role can work from the same up-to-date picture, tailored to what they need.
The Challenge: Staying Aligned as Things Change
The hard part isn’t finding a metric — it’s maintaining shared, situational awareness that stays useful as the SOC changes. Different personas need different answers, and the “right” view shifts daily: a case backlog spike, an SLA risk trend, a new noisy source, or a sudden concentration of critical work.
When the view isn’t easy to tailor and reuse, teams end up re-answering the same questions with ad-hoc slices of case data. Torq Cases Dashboards are designed to make those answers continuously available instead of not a one-off exercise.
The questions are familiar:
- What should we focus on right now — and what’s changing?
- Where are we falling behind (SLA risk, triage bottlenecks, unassigned work)?
- Are we getting more effective over time (MTTR, MTTA, throughput, SLA trends)?
- How are AI and automation impacting my cases?
- Where should we improve next (process, automation, AI)?
What Teams Actually Need
Impaired situational awareness creates a few practical problems:
- Patterns show up late. Backlogs, SLA risk, duplicate spikes, or noisy detections become visible only after they’re already painful.
- Operational decisions get harder. Workload balancing, escalation priorities, and coaching become guesswork when the data is fragmented.
- Sharing insights is slow. The same questions get answered repeatedly for different audiences, and each answer requires another round of manual stitching.
The cost isn’t just time. It’s slower decisions, uneven execution, and fewer cycles spent improving triage, detections, and automation.
SecOps practitioners need a real-time operational dashboard for case data — one that shows trends across cases (and, when relevant, across workspaces), and that lets you transition quickly from “something’s changed,” to “these are exact cases that explain it.”
Meet Torq Cases Dashboards
Cases Dashboards make it easy to build and customize real-time views of SOC posture and case operations across workspaces, so teams can track trends, drill into the cases behind every metric, and share insights and outcomes with stakeholders.
They’re built for the way SOCs actually work inside Torq HyperSOCTM: fast pivots, dynamic prioritization, and translating operational data into decisions. All without adding another reporting ritual.
Cases Dashboards are designed to sit at the center of day-to-day SOC operations, addressing the unique needs of different users:
- Leaders use dashboards to understand posture, performance, and risk exposure at a glance.
- SOC managers track throughput, workload distribution, and SLA health.
- Analysts use dashboards as an investigation starting point, moving from patterns to the exact cases driving them.
This is not reporting for reporting’s sake. No one has time for that. Instead, this is up-to-date operational visibility that directly informs action.
Key Capabilities and Benefits of Cases Dashboards
Build Dashboards That Answer Your Questions — Fast
Cases Dashboards are built for customization without ceremony. You can take a question you care about (SLA risk, MTTR/MTTI/MTTT, workload balance, a noisy source, a spike in criticals), turn it into a visual view across cases, and adjust it as the SOC changes.
Instead of digging through lists, you build a dashboard that makes the signal obvious: what’s trending, what’s stuck, and what needs attention.
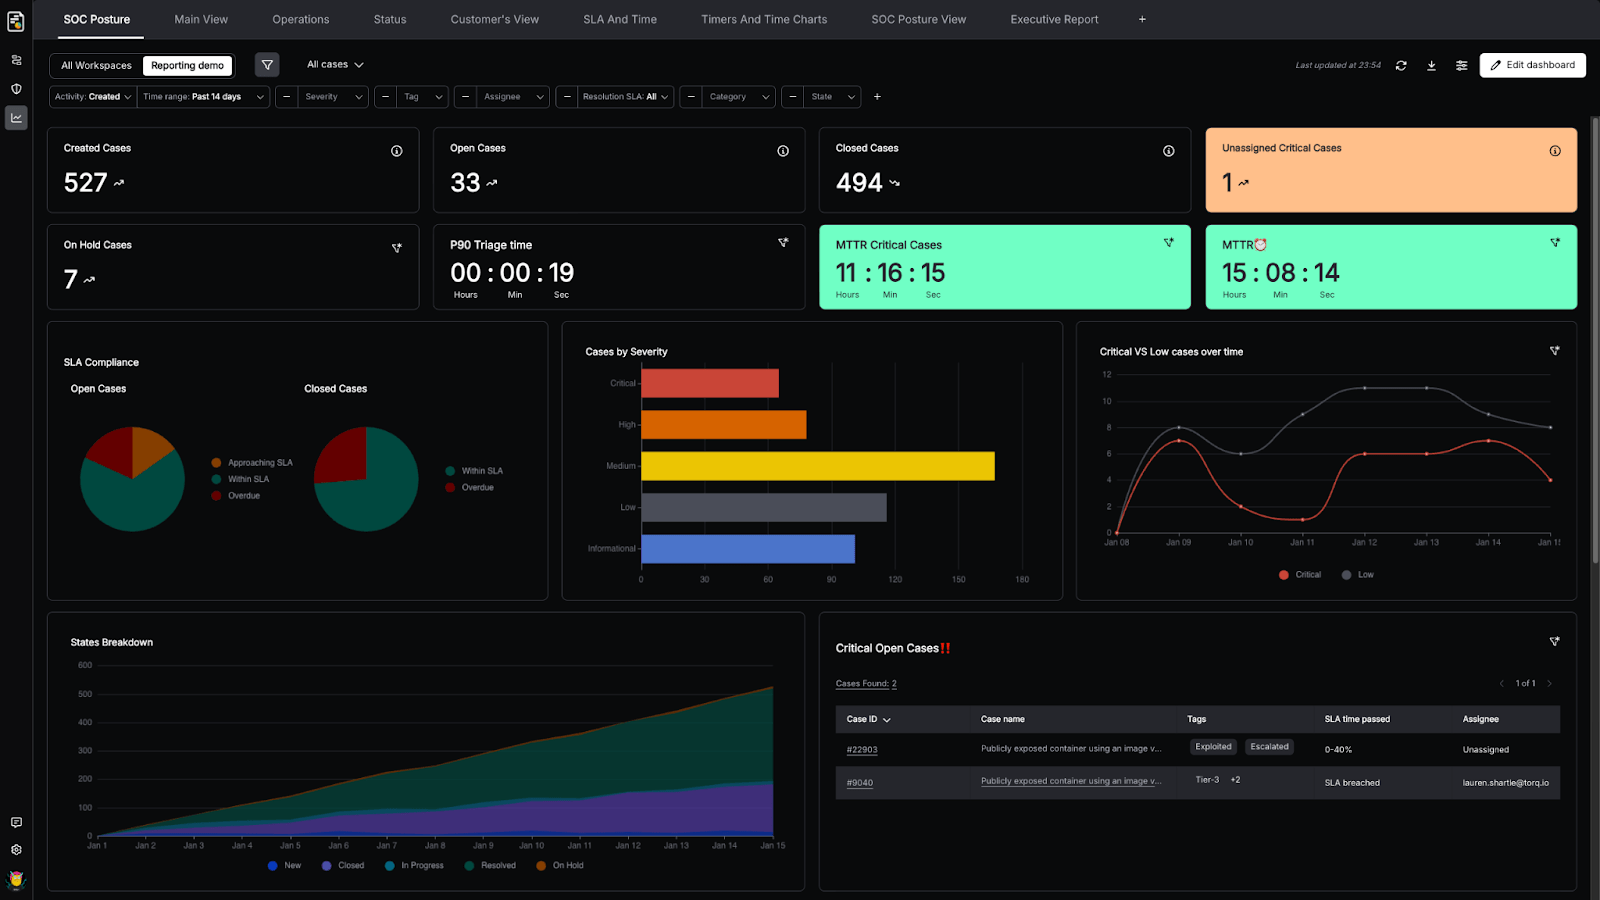
See Trends and Posture in Real Time (and Over Time)
The same dashboard can support “right now” operations and longer-term analysis. Track case volume and severity mix, SLA compliance, throughput, and performance over time — then zoom in when something starts drifting.
This is where dashboards stop being “status” and become operational awareness: you spot the change early, before it becomes a fire drill.
Move from a Metric to the Cases Behind It
When a number looks off, you shouldn’t have to guess why. Cases Dashboards let you jump directly from a widget into the underlying cases that produced it: investigation and process follow-up are one click away. That’s what turns dashboards into a working tool: a spike isn’t just a spike — it’s a set of cases you can inspect and act upon.
Start with the SOC Posture Template (Then Tailor It)
The SOC Posture Template gives you a head start on day one. Reuse it as is, or tailor versions for specific audiences, such as leadership, SecOps, a particular workspace, or a report for a business unit. You keep the common language, but each audience gets the view that fits their unique needs.
Share the Story with Stakeholders
Dashboards are meant to be shared. When it’s time to update leadership, customers, or auditors, you can share a consistent view and point back to the same operational truth the SOC uses day to day. This means faster updates, with less friction and more alignment to the same data.
Cases Dashboards Customer Benefits
At its most basic distillation, Cases Dashboards deliver three practical outcomes:
- Less manual reporting work: Fewer exports, fewer screenshots, fewer “can you pull this number?” requests
- Faster operational decisions: Trends and risk are visible early which means quicker, better-informed decisions
- Clearer communication: A consistent view you can share internally or externally
How SOC Teams Use Cases Dashboards
Turn Cross-Case Data into Repeatable Answers with Widget Builder
The Widget Builder is where dashboards become specific to your SOC. You choose what you want to measure, how to break it down, and how to visualize it, so the same questions don’t have to be re-solved every week. You may even want to track the number of cases handled by AI or automation. The flexibility is yours.
- Case count shows how many cases match your filters and groupings, so you can track volume, mix, and distribution across your case data.
- Case events show what changed during a case lifecycle, so you can measure escalations, on-hold movements, and other transitions as they happened and assess your SOC health — not just what cases look like right now.
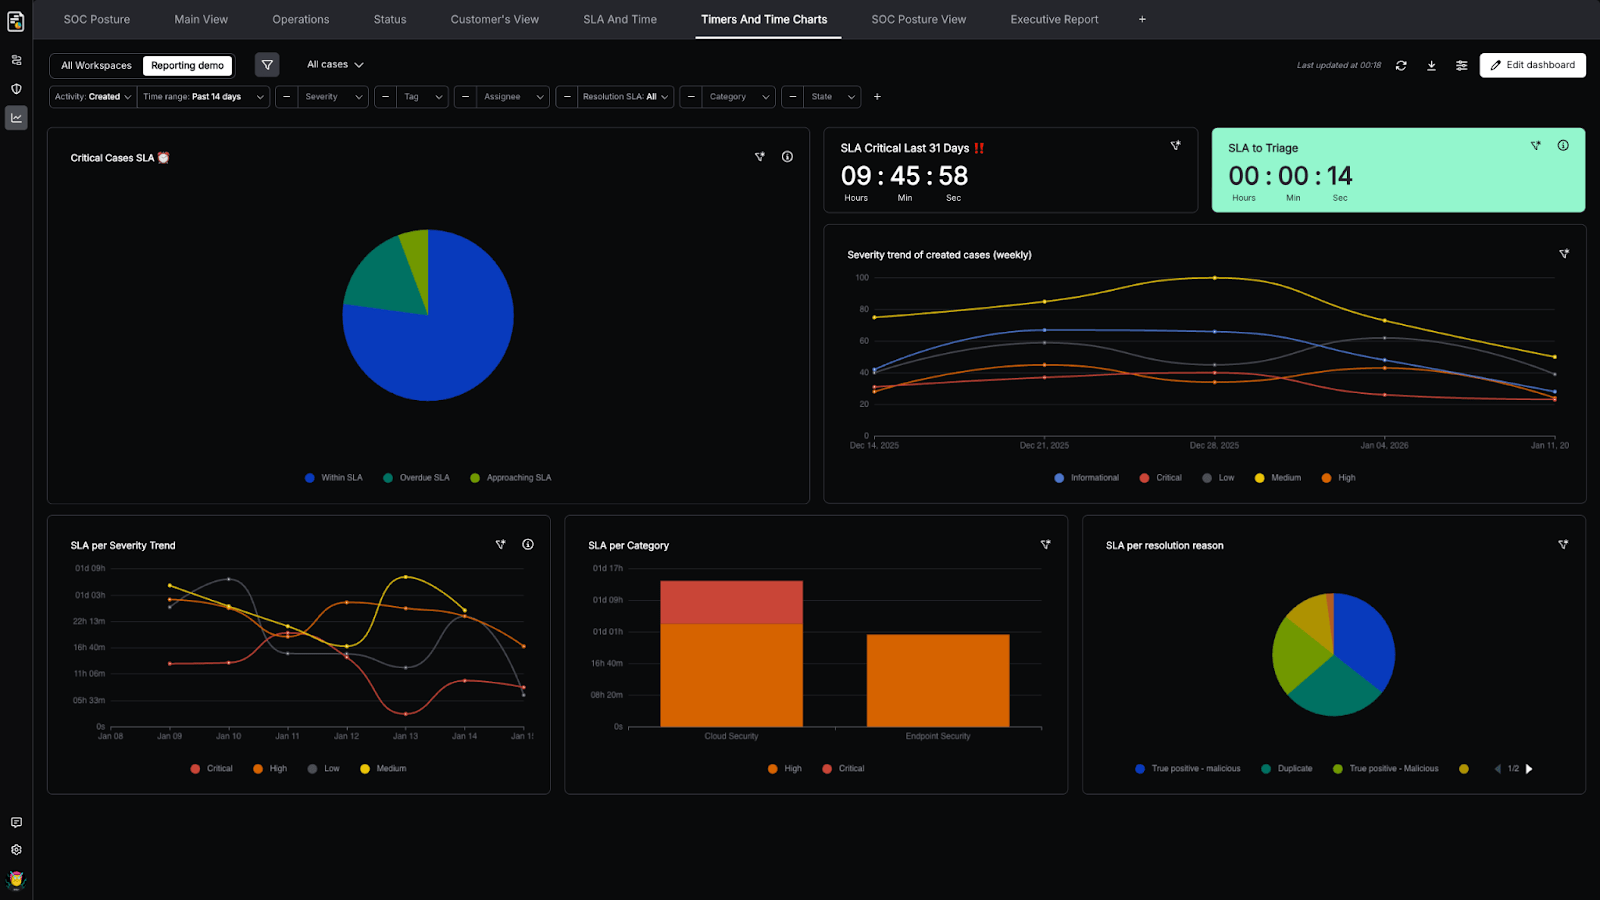
- SLA timers show time-based performance using standard or custom SLAs. You can summarize performance using averages, medians, or long-tail-safe metrics like P90, then break it down by any dimension to understand where time is being spent.
You can group by one or more dimensions and choose the right visualization to see trends and breakdowns, for example, by SLA, category, assignee, tags, business unit, or any custom attribute.
The following video shows how easy it is to create a dashboard widget that tracks the number of cases closed by our AI SOC Analyst, Socrates, over the last month, and categorizes them by resolution type (True Positive: Benign, Malicious, etc).
Operate Across Customers with Omni-View
For MSSPs and MDRs, the challenge is staying consistent across many customers without losing separation and control.
Omni-View lets you monitor posture and performance across workspaces in a single, convenient location, with cross-customer controls to keep visibility and access scoped appropriately. You can keep a reusable, board-ready view across tenants, then pivot to a specific customer when needed and tailor dashboards per customer.
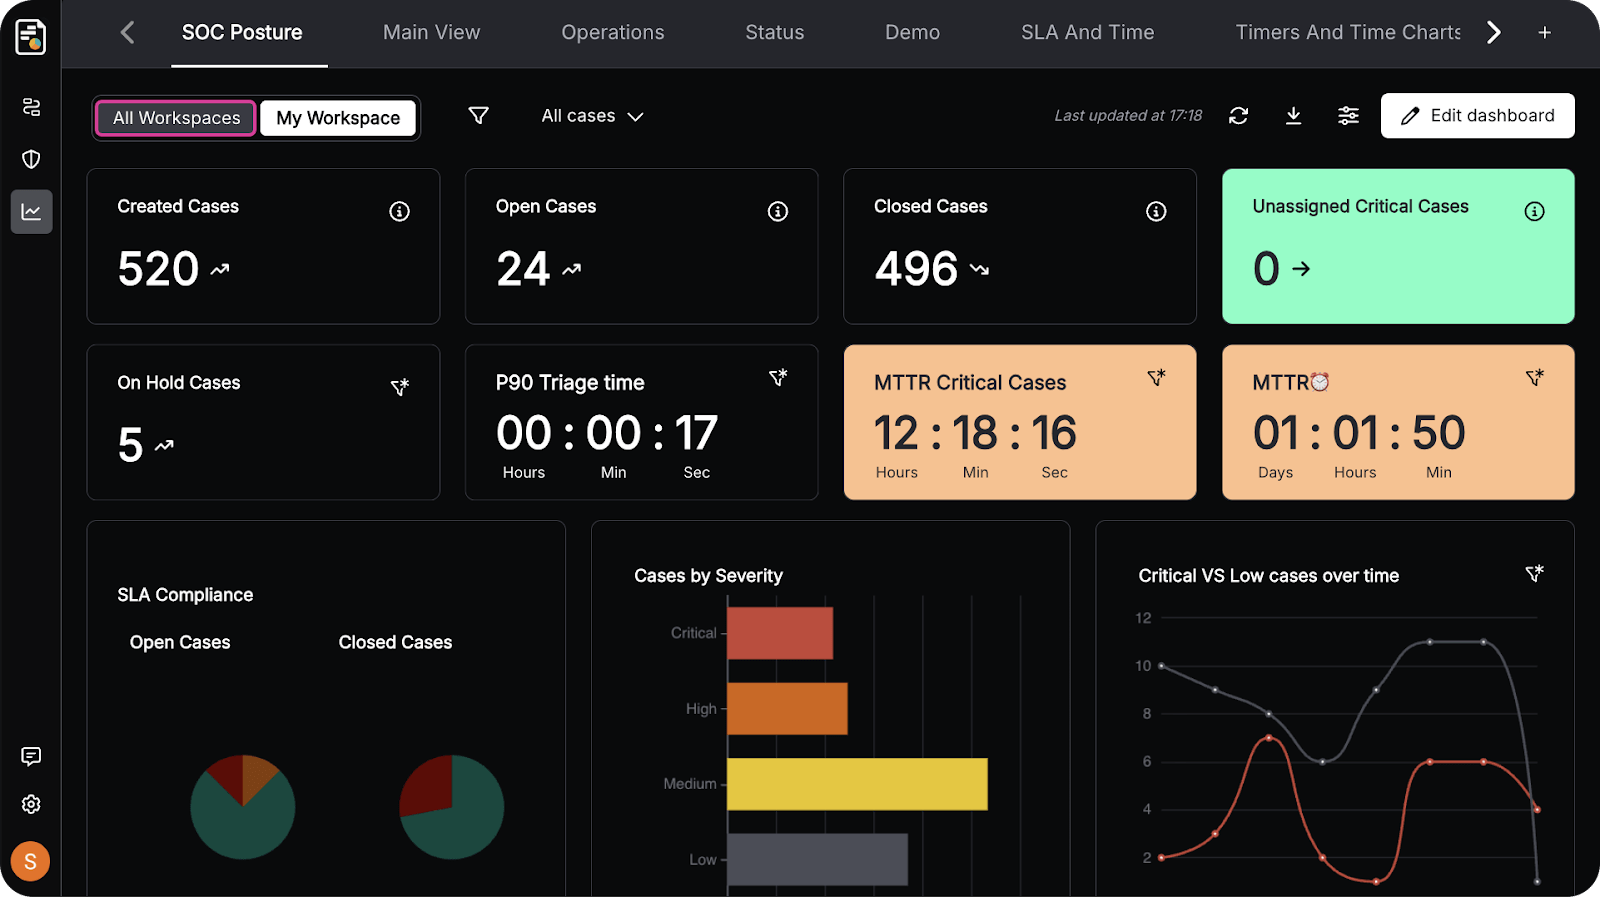
Filter Live Dashboards and Drill into What Matters
In security operations, the goal is focus. Teams filter dashboards to the scope they care about — a team, a workspace, a case type, a severity band — and immediately see what’s changing.
When something looks particularly interesting, drill down from the metric to the underlying cases to take action. This keeps dashboards lightweight but actionable: spot the risk, click into the work, and move.
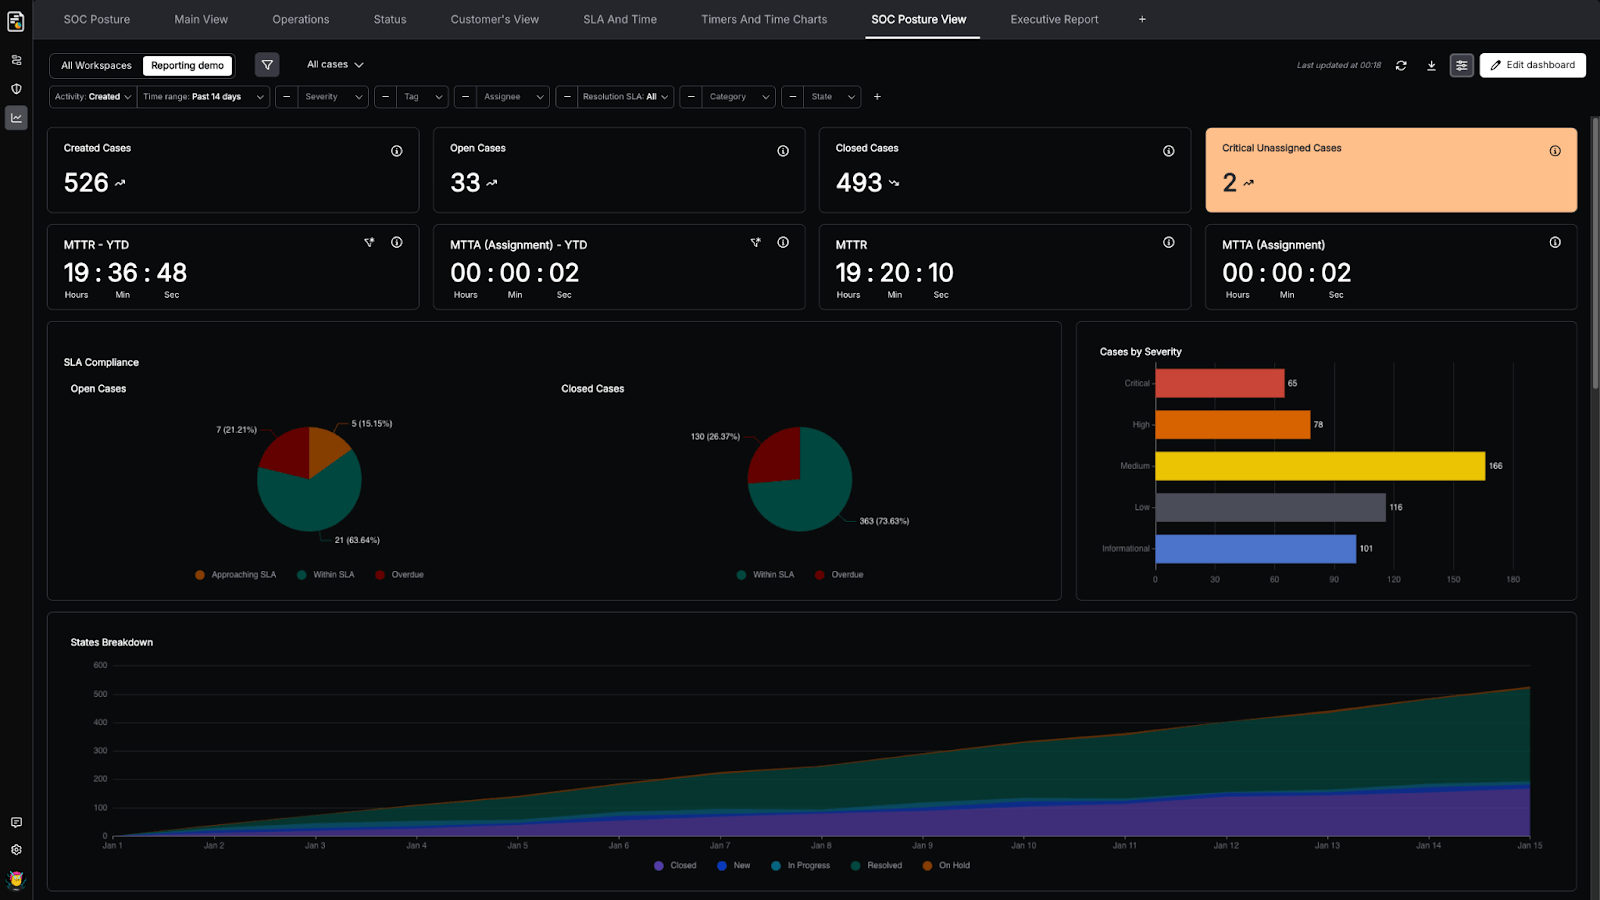
Keep Dedicated Views for Each Audience
Teams can create dedicated dashboards for different outcomes — SOC Posture, Efficiency Report, SOC Operations, Compliance Report, or Executive Summary — each tuned to the audience and the decision it supports, and easy to share or export as a fixed snapshot when needed.
Instead of a single dashboard trying to serve everyone, senior leaders get a clear, board-friendly view, while the SOC focuses on operational details, all backed by the same live case data.
Get Started with Cases Dashboards
Cases Dashboards turn Torq HyperSOC case data into tailored, real-time operational visibility, which helps SOC teams track trends, understand posture, accelerate investigations, and communicate more clearly with stakeholders.
Torq is transforming SecOps for enterprises like Carvana, Valvoline, Virgin Atlantic, and PepsiCo. See how agentic AI and Hyperautomation can do the same for your team.